Analytical Report: Exploring the Relationship Between GDP per Capita and Life Expectancy
Project Objective
This project examines the relationship between a country’s economic performance, measured by GDP per capita, and health outcomes, represented by life expectancy. By identifying trends, patterns, and correlations, we aim to understand how economic factors influence health and to identify outliers that suggest the influence of other factors, such as healthcare policies or cultural practices.
Data Overview
The analysis uses two datasets:
- GDP per Capita Data: Annual GDP per capita values for multiple countries across several years.
- Life Expectancy Data: Annual life expectancy values across the same countries and years.
Both datasets were reshaped, standardized, and merged for a unified analysis of GDP per capita and life expectancy.
Data Preparation and Preprocessing
- Reshaping: Each dataset was converted from wide to long format, where each row represents Country, Year, and the corresponding indicator.
- Data Cleaning: Values with "k" suffixes in GDP per capita (e.g., 10k) were converted to numeric format (e.g., 10,000).
- Data Merging: The cleaned data sets were merged on Country and Year.
This data preparation process involved advanced data wrangling and cleaning techniques, essential for handling real-world data inconsistencies.
Exploratory Data Analysis (EDA) and Key Findings
1. Summary Statistics and Correlation
- Summary Statistics: Descriptive statistics showed significant variability in both GDP per capita and life expectancy across countries, illustrating the diversity in global economic and health conditions.
- Correlation Analysis: A correlation coefficient calculation showed a strong positive relationship between GDP per capita and life expectancy, suggesting that as GDP increases, life expectancy also tends to rise.
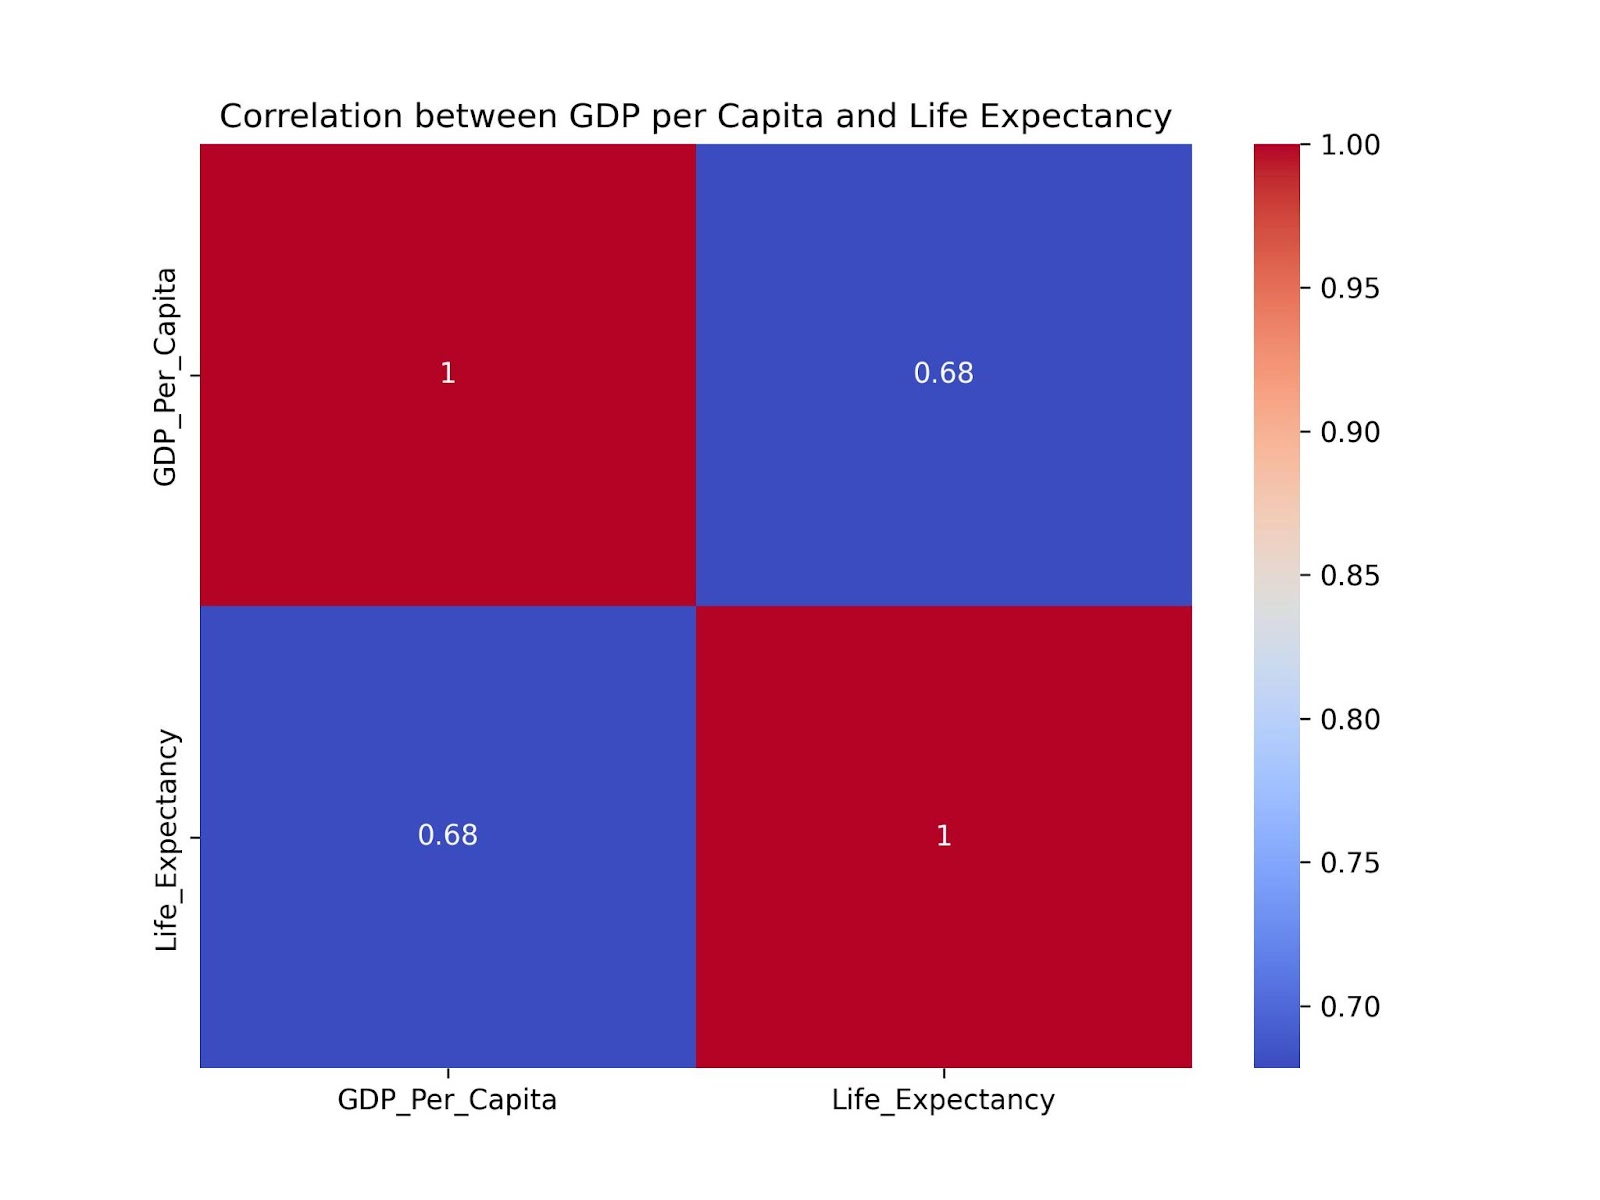
This heatmap visually reinforces the positive correlation between GDP per capita and life expectancy, showing a strong association between economic and health metrics.
2. Data Visualizations and Insights
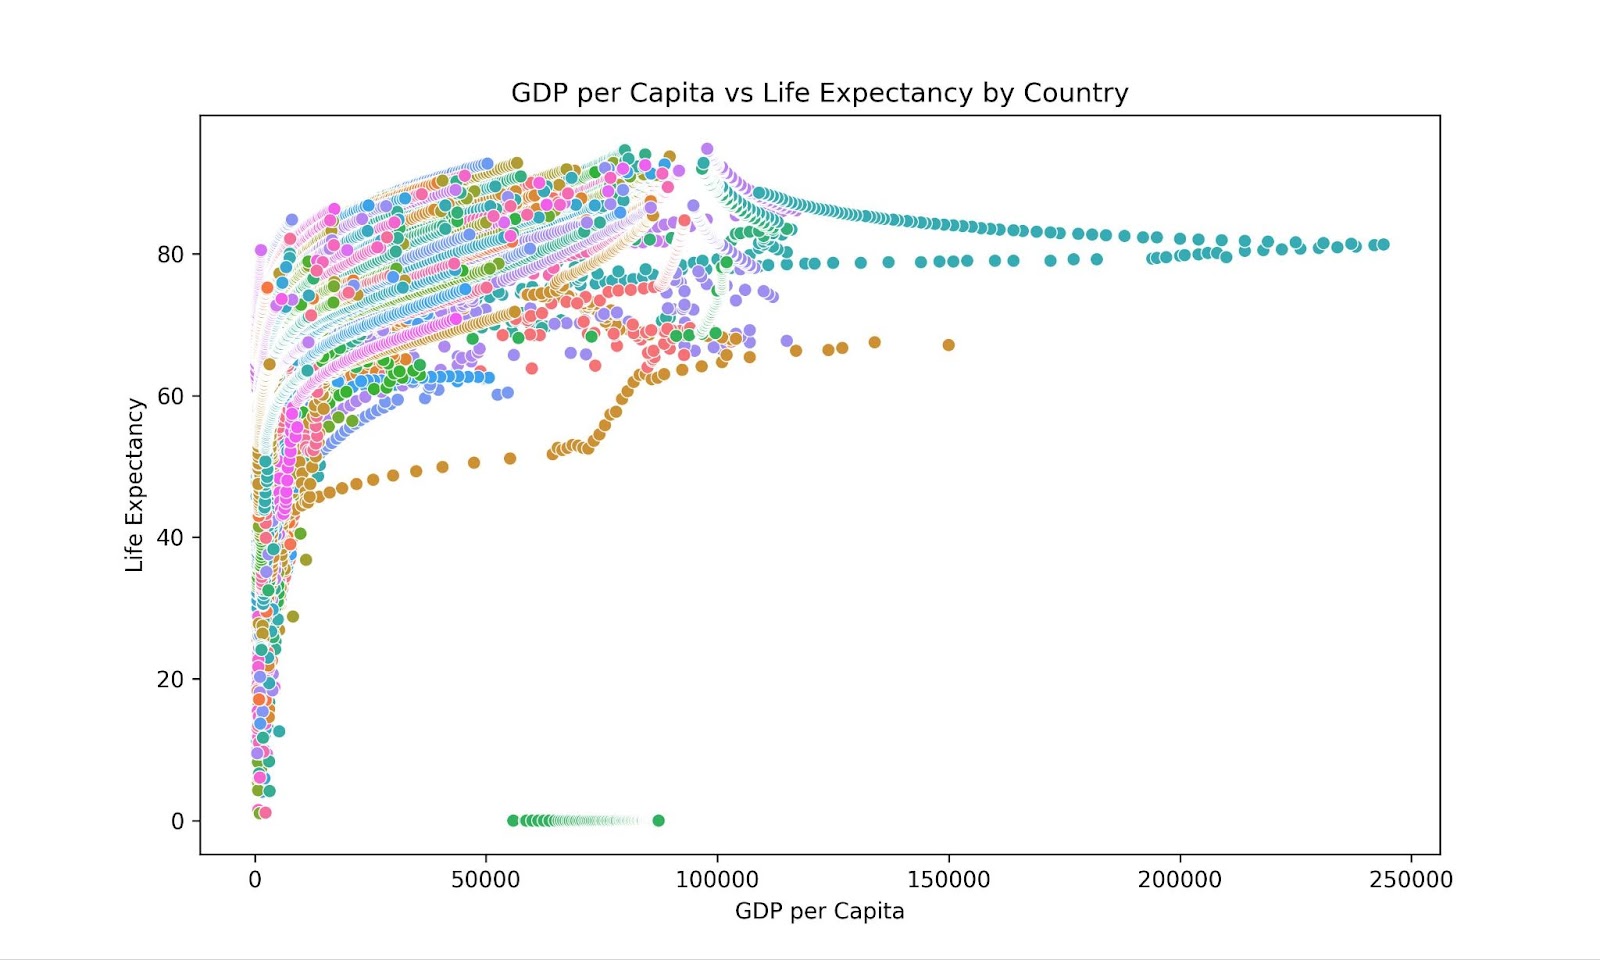
- Scatter Plot of GDP per Capita vs. Life Expectancy:
- This scatter plot visualizes the relationship across countries and highlights a clear upward trend, indicating that countries with higher GDP per capita generally experience higher life expectancy.
- Insights: While wealthier countries tend to have higher life expectancy, some countries deviate from this trend. Certain low-GDP countries achieve relatively high life expectancy, potentially due to effective health policies or cultural practices.
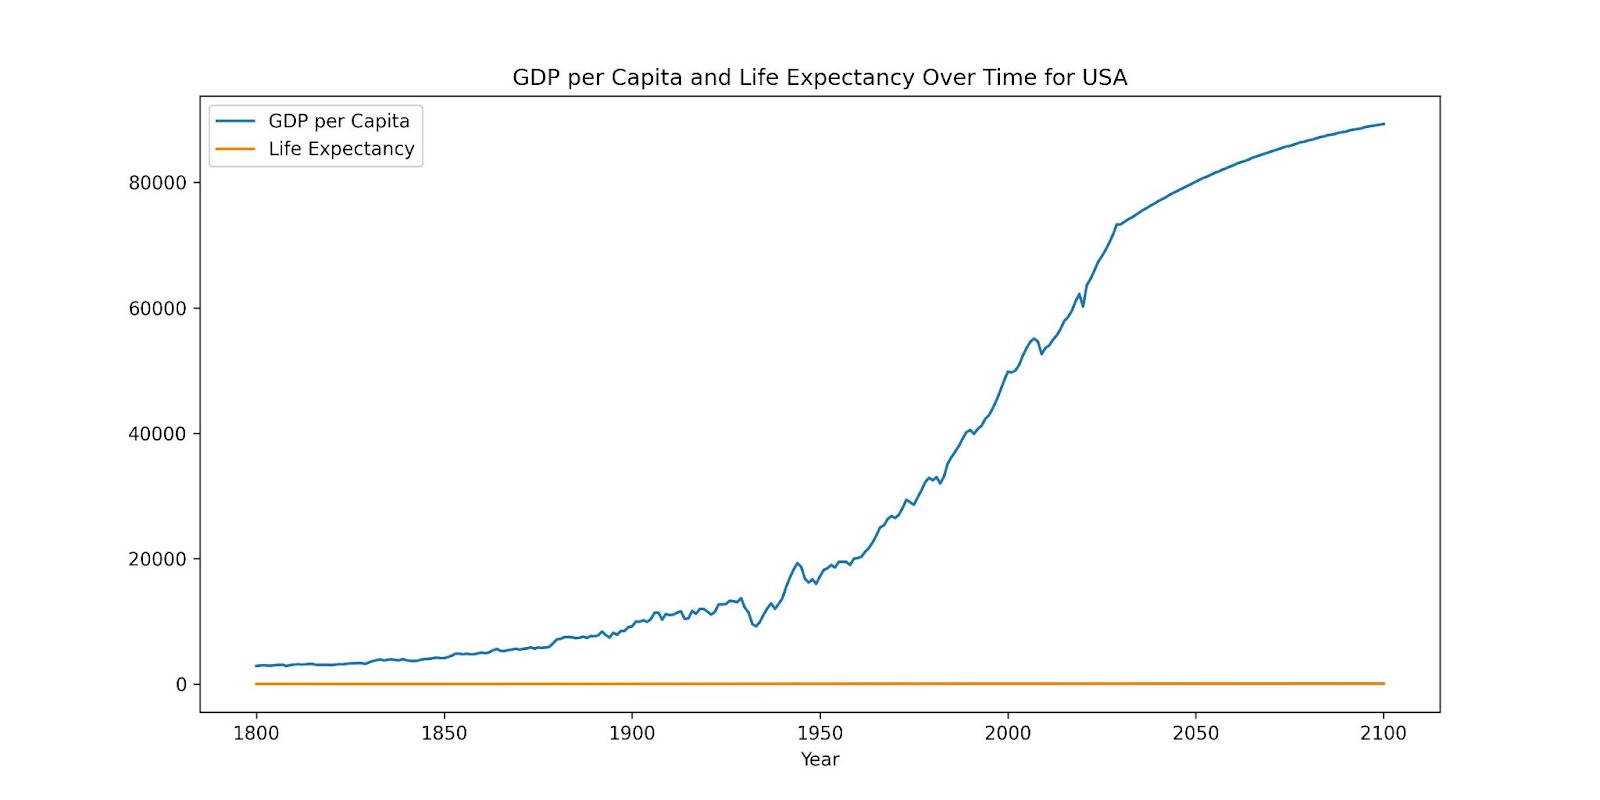
- Time-Series Analysis for Specific Countries (e.g., United States):
- This time-series plot tracks GDP per capita and life expectancy for a specific country, such as the United States, over time.
- Insights: Life expectancy typically shows a steady upward trend, while GDP per capita may experience fluctuations due to economic cycles. Some delay in life expectancy improvements following GDP growth suggests a lag effect where economic changes take time to impact health outcomes.
Skills Demonstrated
This project highlights a range of technical and analytical skills:
- Data Cleaning and Transformation: Reshaping data, handling inconsistent formats, and merging datasets.
- Statistical Analysis: Quantifying relationships between variables, detecting trends, and identifying outliers.
- Data Visualization: Developing clear, meaningful visuals using Matplotlib and Seaborn to communicate insights.
- Trend and Time-Series Analysis: Exploring temporal trends to understand changes over time, a critical skill for forecasting and strategy development.
Business Applications
The findings from this analysis have several practical applications:
- Policy and Strategy Development: Identifying countries that achieve high life expectancy with lower GDP per capita can offer best-practice models for healthcare and public policy.
- Market Segmentation and Targeting: Clustering countries by economic and health indicators can assist businesses in tailoring products or services for specific regions.
- Health and Economic Forecasting: Extending this analysis to forecast health outcomes based on economic trends could aid in anticipating and preparing for future changes.
- Benchmarking and Performance Analysis: Outliers and high performers provide benchmarks for organizations aiming to improve health outcomes independently of economic factors.
Conclusion
This analysis reveals a strong positive relationship between GDP per capita and life expectancy, suggesting that economic growth generally supports improved health outcomes. However, notable exceptions demonstrate that other factors, such as healthcare efficiency, policy, and culture, also play significant roles.
Explore More:
- View the complete Code on GitHub for data cleaning, analysis, and visualization.